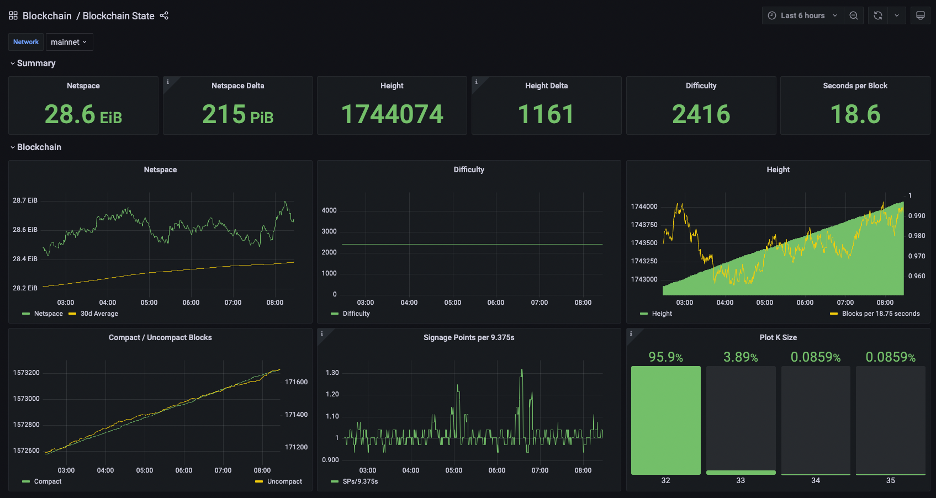
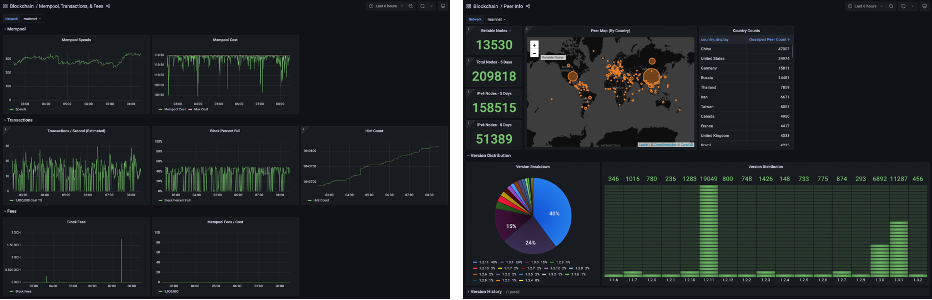
Today, I’m excited to announce the public release of our Chia Dashboards. The site currently has 3 dashboards providing a glimpse into the blockchain and peer network. We’re building this network together – the primary goal of these dashboards is to provide an accurate and third-party verifiable accounting of the blockchain and its state. A secondary benefit is that we think data is beautiful and watching “number go up” is a fun pastime.
The initial dataset includes netspace, mempool cost, fees, mix of winning plot sizes, compact vs uncompact blocks, peer counts and countries, and version distribution, among other data.
The data is exported using chia-exporter, which establishes a websocket connection to the Chia RPC services, listens for metrics events, and then translates the data it receives into a prometheus http endpoint. With chia-exporter running, a prometheus instance is set up to scrape the data exposed by chia-exporter. A solution for long term storage of data (Thanos) and caching is stuck in the middle, and we finally get to the front end, which is a grafana instance, available in the pub-metrics-grafana repo.
Now that the public dashboards are available, we’ll be iterating on the chia-exporter to include more metrics geared towards tracking farming, in addition to the already available network and peer focused metrics.
Chia-exporter is currently under fairly active development, and may have a few bugs here and there, but we welcome issues or pull requests if you encounter any in the repository. We hope you enjoy digging into this data as much as we do.